- SG Thoughts
- Posts
- Are futures good for your token?
Are futures good for your token?
Explore whether future listings help token price.
Simplicity Group
18 Jul
Future contracts have become a vital part of the broad trading landscape, offering traders the ability to speculate on the future price movements of assets and securities. These financial instruments allow traders to implement different strategies depending on their risk appetite, trading experience, and knowledge.
While futures can be a valuable tool for hedging and strategic trading, they also introduce the potential for market manipulation. Whales (individuals or entities) can exploit these instruments to manipulate prices in their favour, often leading to significant gains for themselves and substantial losses for smaller traders.
Or at least, that’s the hypothesis.
Said price manipulation through futures consists of whales pushing the price of a token up to trigger liquidations on short positions (or vice versa), thereby maximizing their profits on long (or short) positions. This manipulation can result in short-term volatility and losses for many traders.
Crypto is no different.
In this article, we explore the impact of futures listings on various crypto tokens, analyzing their performance relative to both USDT and BTC pairs, to rule out or confirm the hypothesis of whether these contracts generally lead to significant price movements and to what extent whales might be influencing these trends.
Basics
What are Longs
To begin, let’s take a quick look at the fundamental concepts of longs and shorts in trading to better understand these strategies and their potential for market manipulation.
In trading, longs refer to a position that consists of an investor buying an asset with the expectation that its price will increase. The driver for investors to implement this position is based on the belief that the value of the asset will rise over time, allowing the trader to sell it at a higher price for profit.
In the context of futures trading, going long means entering into a contract that allows the trader to buy an asset at a predetermined price at a future date.
What are Shorts
On the other hand, shorts refer to a trading position where an investor borrows an asset and sells it with the intention of buying it again later at a lower price. In contrast to longs, this strategy allows the trader to profit from a decline in the asset’s price.
In futures trading, going short means entering into a contract that lets you sell an asset at a predetermined price at a future date.
How they impact prices
Longs
Longs can impact the price of an asset by increasing the demand for it if many traders take long positions, which at first hand can increase liquidity. However, if the price starts to fall, all traders with long positions might recur to close the longs to cut losses. Closing a long position is the same as selling, which not only takes out buy pressure but creates sell pressure in the market, driving prices lower.
Overall, an increase in longs indicates a bullish sentiment as it suggests that many traders expect the price of an asset to surge, leading to an increase in buying pressure, pushing the asset’s price to rise. But it can also be manipulated to drive prices lower by forcefully driving price lower to liquidate longs.
Shorts
An increase in short positions indicates bearish sentiment, suggesting that traders expect prices to fall. This can lead to increased selling pressure, pushing the asset’s price lower. However, if the price starts to rise unexpectedly, short sellers might rush to close their positions (which is the same as buying), leading to a short squeeze that can cause rapid price increases.
An increase in shorts indicates a bearish sentiment but can be manipulated to drive prices up.
Case Study: 20 tokens that launched futures and their performance after
Now that we understand the potential effects of each trading strategy on price action and market sentiment, we can dive deeper to see how futures listings affected a token’s performance in the real world.
Is it good for a token to be listed on futures?
The primary thesis to be proved is the following: there is significant buying pressure followed by price declines due to whale manipulation shortly after futures listings.
Methodology
We went over 20 tokens that had futures listed on Binance to see the desired phenomenon. The following table shows which tokens were used in the analysis, which are mainly top tokens in different narratives along the date on which their futures were launched. We compared the token price to USDT and BTC.
Limitations
There are a plethora of other factors that one would need to consider to conclusively state whether futures are a positive or a negative for a token’s price performance, but we tried to alienate as much of these as possible by choosing tokens from different narratives, compared to BTC, listing at different points in history.
Moreover, we only looked at 20 tokens, which are the top tokens for different narratives. This means there is an overall general trend of these tokens growing in value along with their narratives, creating an intrinsic positive bias over the long term.
Lastly, this short case study did not look into price performance before the futures listings, implying that the results may be a continuation of an existing trend.
Tokens to USDT
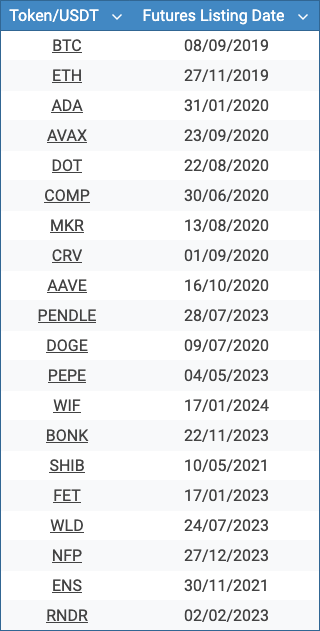
20 tokens used by Simplicity Group in our analysis
As part of our initial analysis, we examined the tokens’ performance post-futures launch using their pairs with USDT. The table below shows the data for these pairs, including their futures listing dates, and the price movements over several time frames following their launch.
It includes data on the price at the time of the futures listing and successive price changes at one week, two weeks, three weeks, one month, two months, three months, and one year intervals.
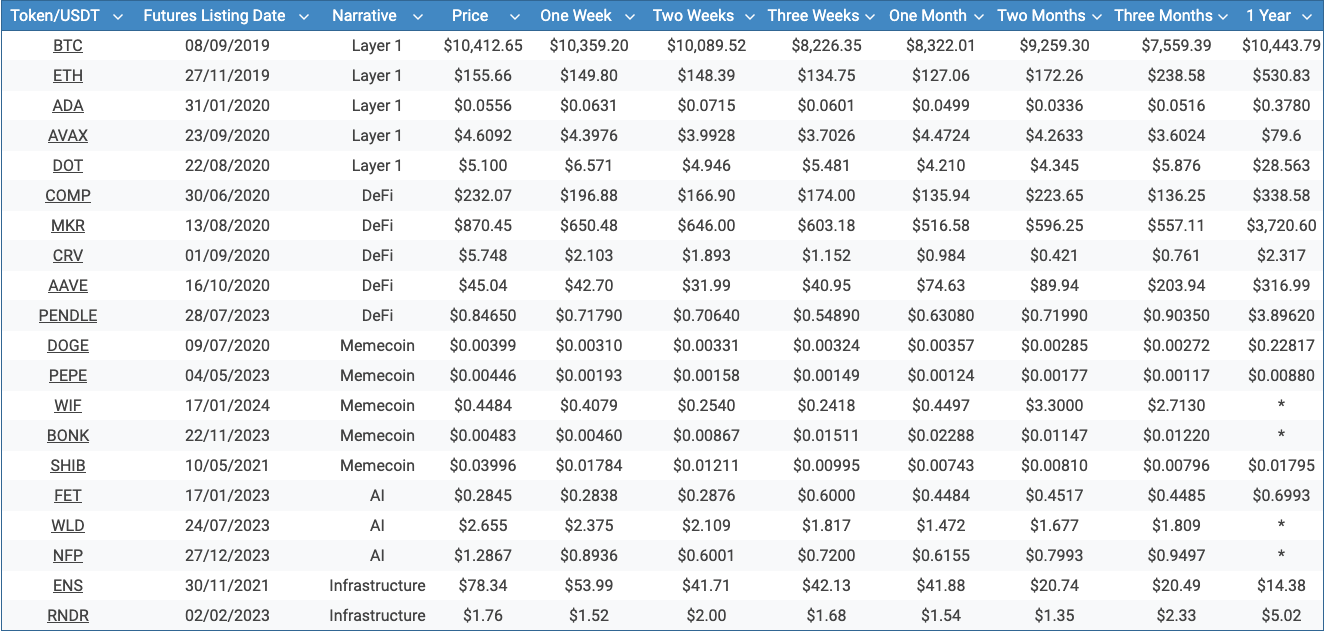
20 tokens/USDT prices over time.
WIF, BONK, WLD, and NFP listed relatively recently, therefore no data is available for the 1-year time interval.
Below you can find the percentage change for all the predetermined time intervals and as part of the observations drawn from the data.
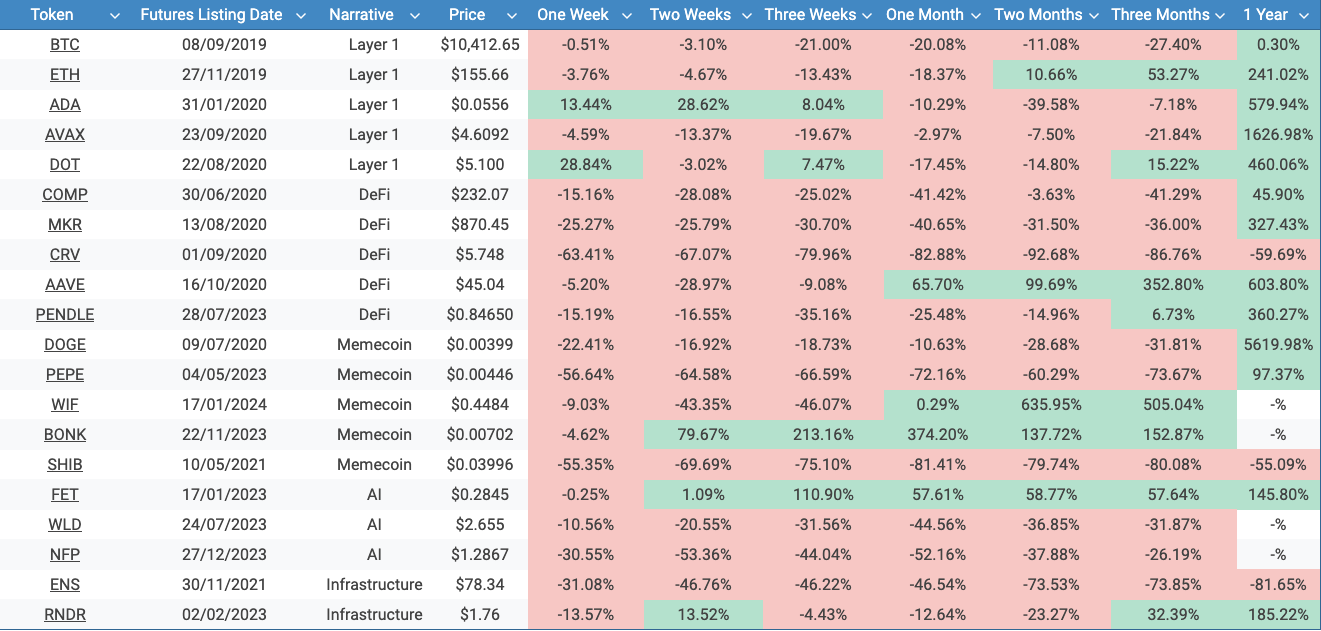
20 tokens/USDT price changes over time as a percentage.
We find the following:
Short-Term Performance (One Week to One Month)
Only 10% of tokens were positive after one week.
Only 20% of tokens were positive after one month.
This trend is more evident in tokens like CRV (-63.41% in one week), PEPE (-56.64$), SHIB (-55.35%), ENS (-31.08%), and NFP (-30.55%).
The price decline generally doesn’t change after the first week, but the trend is maintained over the first 4 weeks after the futures launch.
Mid-Term Performance (Two to Three Months)
25% of tokens were positive after two months.
40% of tokens were positive after three months.
The mid-term analysis shows a mix of recoveries and new declines.
Tokens like AAVE show significant recovery (99.69% in two months), while others like CRV (-92.68% in two months) or WLD (-46.32% in two months) continue to decline.
Long-Term Performance (One Year)
81.2% of tokens are positive after one year. This however is likely partially due to our token selection, as mentioned above.
Over a one-year period, some tokens exhibit substantial gains, such as DOT (460.66% up) and ETH (241.02% up), indicating a potential for long-term recovery despite initial setbacks.
On the other hand, tokens like ENS, CRV, and SHIB continue to show significant declines.
Tokens to BTC
In the process of analyzing the TOKEN/USDT pairs, we realized that these pairs might not provide the most accurate price due to the influence of Bitcoin’s price on the overall market.
To isolate the specific effects of futures listings on tokens, we decided to recollect the data by using TOKEN/BTC pairs. Using these pairs was with aims of mitigating the prominent impact of Bitcoin’s price movements and focus on the strength of each token relative to Bitcoin.
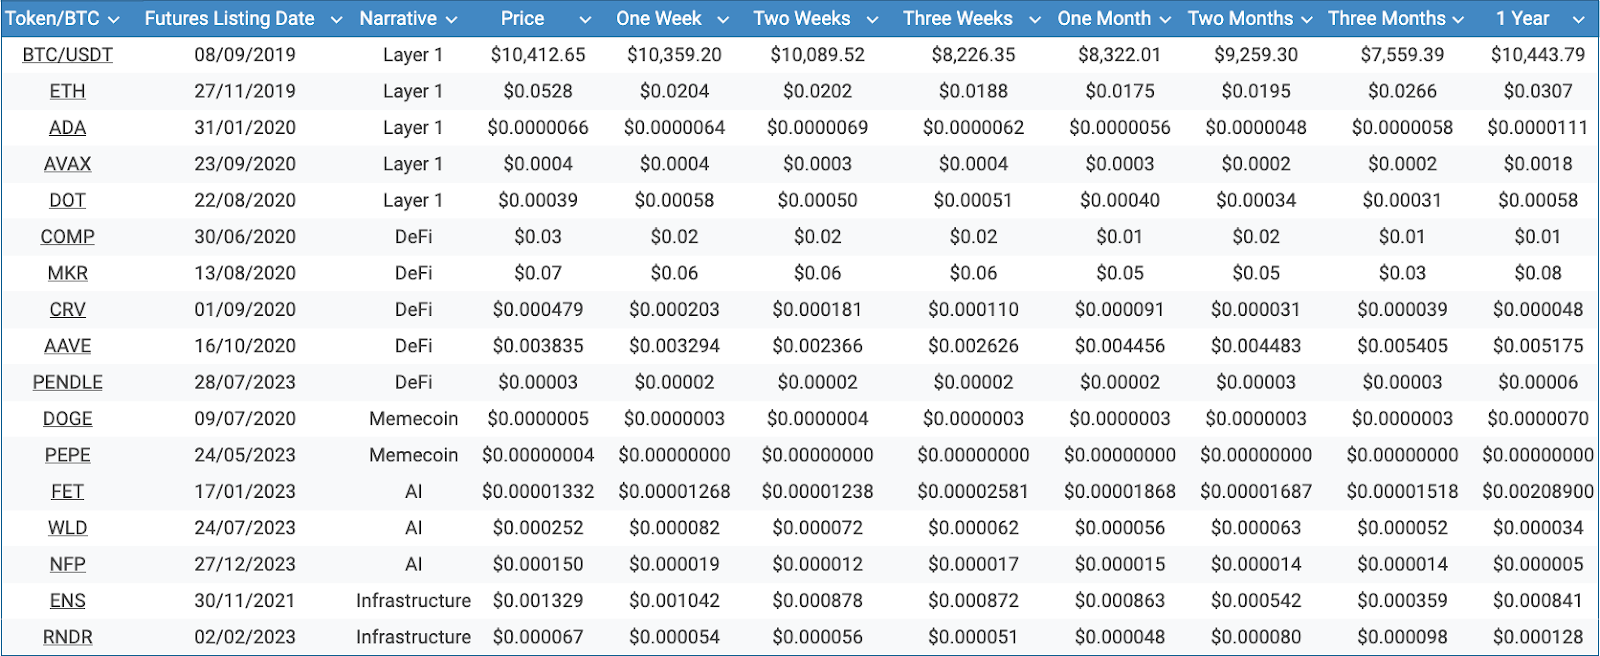
17 tokens/BTC prices over time. Seeing as Excel doesn’t have a ₿ symbol, we kept it as $, but the prices are in Bitcoin.
In this case, $WIF, $BONK, and $SHIB didn’t include the entire required timeframe, therefore, they were excluded from the analysis.
Once again, in the table below, we look at changes in price relative to Bitcoin.
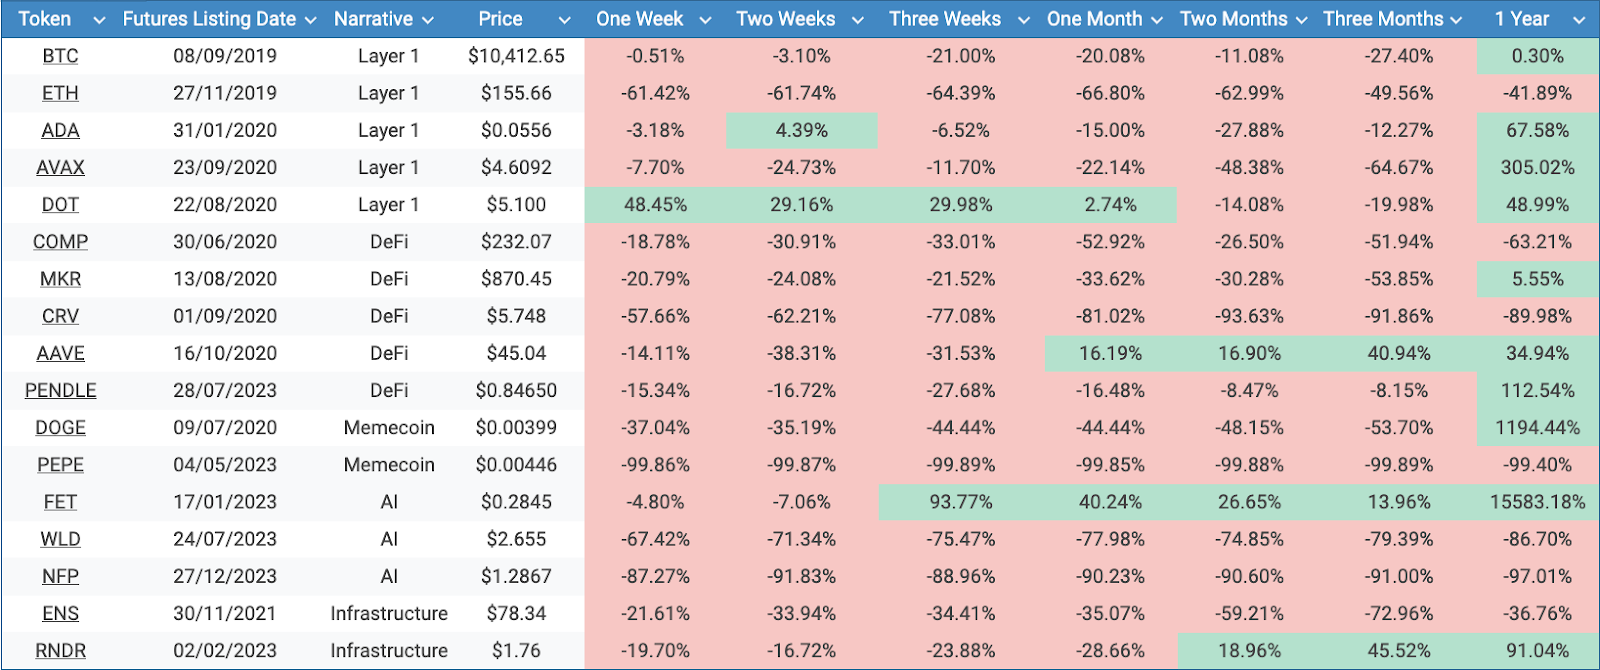
17 tokens/BTC price changes over time as a percentage.
We find the following:
Short-Term Performance (One Week to One Month)
Only 1 token (6%) was positive after one week.
18% of tokens were positive after one month.
Most tokens show a significant price decline within the first week after futures launch. Notable examples include PEPE (-99.86%), NFP (-87.27%), WLD (-67.42%), ETH (-61.42%), and CRV (-57.66%).
This trend continues over the two-week, three-week, and one-month periods, with only a few tokens like DOT showing any positive price movement initially. DOT is an uncommon case in this study, presenting an uptrend beginning in the first week after futures launch (48.45% up).
Another atypical case is FET which experienced only slight downtrends in the first and second week, but after the third week commences an upward trend (93.77% up in the third week).
AAVE shows signs of recovery after the initial price decline (up 16.19% in the third week).
Mid-Term Performance (Two to Three Months)
18% of tokens were positive after one two and three months - the same ones: AAVE, FET, RNDR.
The majority of tokens continue to perform poorly in the two to three months following the futures launch. Examples include AVAX (-48.38% at two months), AAVE (-38.31% at two months), and ENS (-59.21% at three months).
Some tokens, like RNDR, show signs of recovery after the initial decline, with a positive price change at the three-month mark (45.52%).
Long-Term Performance (One Year)
59% of tokens were positive after one year. Again, partially due to our token selection.
That being said, the performance is mixed. Some tokens like DOGE and FET show significant gains (1194.44% and 15583.18%, respectively), while others like PEPE (-99.4%), NFP (-97.01%), CRV (-89.98%), and WLD (-86.70%) continue to decline.
The variability in long-term performance suggests that while futures may have a short-term negative impact, other factors play a more substantial role in long-term price movements.
Overall
While there may be other factors that contribute to the overall downward performance of the tokens, the trend seems to show that futures doesn’t seem to be beneficial for tokens, at least in the first few months after launch.
By comparing to Bitcoin, the result of only 18% of the selected tokens being positive after three months shows some concern with futures.
This is compounded by the fact that these are some of the most popular/blue chip tokens in their given narratives, meaning that they should have a natural, upwards bias.
Furthermore, the analysis indicates that the initial hypothesis of futures launches leading to significant buying pressure followed by downward price action is not strongly supported.
Instead, the trend shows that most tokens experience an immediate or mid-term decline in price following the futures launch. The long-term performance varies, with some tokens recovering and some others continuing to decline.
Conclusion
Our analysis of the crypto tokens’ performance following their futures listing reveals that the initial hypothesis of significant buying pressure followed by price declines due to whale manipulation is inconclusive, given these tokens experience price declines from the week they’re listed.
Most tokens experienced immediate and mid-term declines, suggesting that futures might not be healthy for a token’s price stability. Long-term performance, however, showed significant variability, indicating that other factors beyond futures listings and whale activities play a more substantial role in influencing token prices.